Goals and Objectives:
The goal of this exercise was to use a number of geoprocessing tools to build a suitability model and a environmental/social risk model for sand mining in a selected area of interest in Trempealeau county, Wisconsin. The three main tasks were to: 1) Build a sand mining suitability model 2) Build a sand mining risk model 3) Overlay results to determine best locations for potential mining operationsData Sets/ Sources:
The data used included data from the Trempealeau county public geodatabase, USGS DEM data, NLCD land use data, and water table data from the Wisconsin Geological and Natural History Survey.
Methods:
Before using geoprocessing tools, it is important to make sure that the workspace is set up accordingly. I used a boundary file delimiting my area of interest to limit all raster functions to that boundary, and reduced my processing extent to it as well.
Suitability Model
The first objective was to find suitable land based on geological criterion. Based on previous knowledge and research, I knew which geologic formations were most desirable for sand mining. I converted a Trempealeau county geology feature class to a raster, then performed a reclass on it, ranking each geologic formation based on their desirability. The process is shown in the below model.

The second objective was to find suitable land based on land use. I ranked each land use type based on what I believed was most suitable using the reclassify tool.
For Barren Land/Herbaceuous/Hay/Pasture/Cultivated Crops I assigned a 3.
For Shrub/Scrub I assigned a 2.
For Deciduous Forest/Evergreen Forest/Mixed Forest I assigned a 1.
For Open Water/Developed, Open Space/Developed, Low Intensity/Developed, Medium Intensity/Developed, High Intensity/Woody Wetlands I assigned 0 to exclude these unusable land types.

The third objective was to find suitable land based on the proximity to railroad terminals. I performed a Euclidean distance tool, and assigned values of 1, 2, and 3 using reclassify.

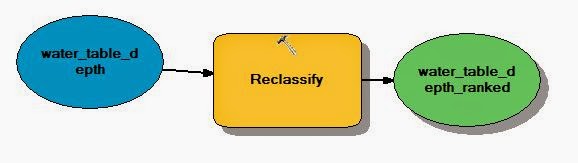
The fourth objective was to find suitable land based on slope. I ran the slope calculator tool on the Trempealeau county DEM file, giving me a % rise, then used a block statistics tool to remove the "salt and pepper" effect and average out the slope values. Then, I ranked and reclassed it.

The sixth objective was to combine all of these criteria rasters into one index model that adds up all of the ranks I had assigned in each of them. This involved using raster calculator to add up each raster. The resulting suitability map is shown below in the results section.

Objective seven included removing the exclude land uses, but I had already done this as a part of objective two.
Impact Model
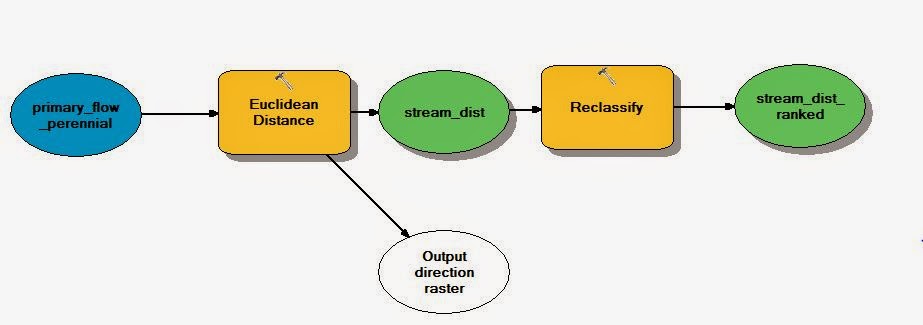
Objective eight included using a DNR hydro feature class to determine environmental impact of potential sand mining operations. I only included primary flow perennial streams. I then used the euclidean distance tool to calculate and reclassify the distances- with 3 having the biggest environmental impact.
For the ninth objective, I projected a prime farmland feature class, and converted it to raster. Next I used reclass to rank based on land that was prime farmland, or at least valuable farmland.

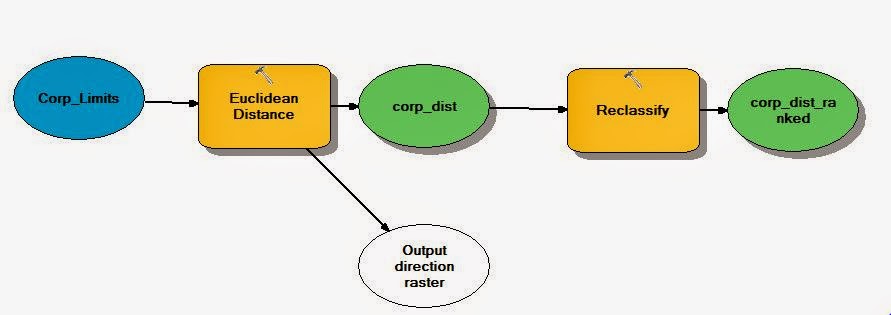
Objective ten involved determining impact based on distance to residential or populated areas. For this, I used a feature class containing corporate boundaries of municipalities. Next, I performed euclidean distance on it, assigning the minimum break a value of 640m, as that is the distance at which a mine cannot be built. These distance classifications were meant to represent a dust shed for potential mines.
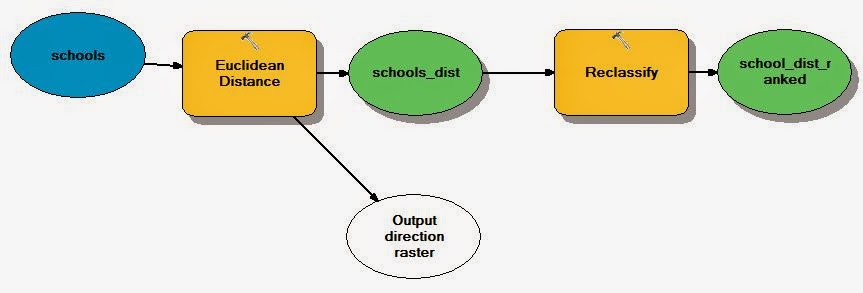
Objective eleven was to determine potential impact on schools. This meant going into the parcels feature class, and querying all parcels with an owner that contained the word 'school' After this, I created a new feature class based on my selection, used the euclidean distance tool, and reclassified the results into rankings.
For objective twelve, I was able to choose a factor of my choice, and use geoprocessing analysis to determine impact on it. I chose wildlife areas, and again used the euclidean distance tool and reclassify tool to determine impact rankings based on distance.

Objective thirteen was to calculate risk: this is basically the same step that I performed on the suitability rasters, but this time I am using raster calculator to add up the values in my impact rasters to determine the impact. This map can be viewed below in the results section.

Objective fourteen was to determine potential visibility of mines from somewhere that could be considered a prime recreational area. For this area, I chose Perrot State Park Campground. I created a layer that just contained this as a point feature, and used the viewshed tool (which uses elevation data) to determine all view-able areas. This map is available in the results section below.
Objective fifteen, the final objective was to overlay suitability results and the environmental impact results to determine the best and worst locations for sand mining. This involved subtracting my environmental/social impact raster model from the suitability raster model, and using the stretched color ramp to symbolize it. This map is also available in the results section.
Results:
 |
| Viewshed Analysis from Perrot SP Campground in Southern Trempealeau County, Wisconsin |

Discussion:
The results of these exercises were interesting- it is important to keep a number of factors in mind modeling suitability or environmental/human impact of mining. The suitability model ended up showing a large portion of the western section as a suitable environment based on these factors. The impact model shows a similar area, but excludes the municipal areas nearby. The overlay shows that central Trempealeau county could be a good place for sand mines. It is important to note that this analysis is based on inferences that might not represent real world data- rather were generated during analysis.
Conclusion:
This exercise was valuable because it taught me a lot about raster analysis, and the different ways that it can be used on different variables and factors. The geoprocessing tools allow the analyst to perform simple tasks, and use simple mathematics to make valuable conclusions about raster data.
No comments:
Post a Comment